
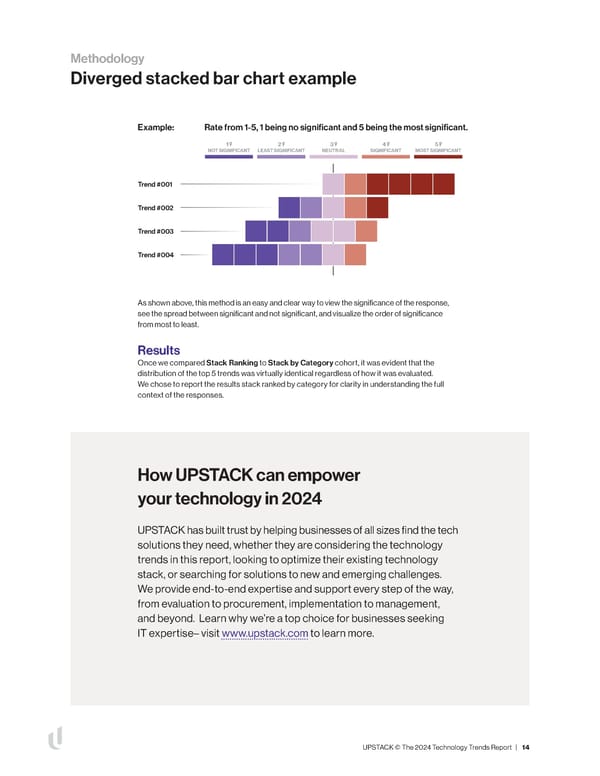
Methodology Diverged stacked bar chart example Example: Rate from 1-5, 1 being no signi昀椀cant and 5 being the most signi昀椀cant. 1 2 3 4 5 NOT SIGNIFICANT LEAST SIGNIFICANT NEUTRAL SIGNIFICANT MOST SIGNIFICANT Trend #001 Trend #002 Trend #003 Trend #004 As shown above, this method is an easy and clear way to view the signi昀椀cance of the response, see the spread between signi昀椀cant and not signi昀椀cant, and visualize the order of signi昀椀cance from most to least. Results Once we compared Stack Ranking to Stack by Category cohort, it was evident that the distribution of the top 5 trends was virtually identical regardless of how it was evaluated. We chose to report the results stack ranked by category for clarity in understanding the full context of the responses. How UPSTACK can empower your technology in 2024 UPSTACK has built trust by helping businesses of all sizes 昀椀nd the tech solutions they need, whether they are considering the technology trends in this report, looking to optimize their existing technology stack, or searching for solutions to new and emerging challenges. We provide end-to-end expertise and support every step of the way, from evaluation to procurement, implementation to management, and beyond. Learn why we’re a top choice for businesses seeking IT expertise– visit www.upstack.com to learn more. UPSTACK © The 2024 Technology Trends Report | 14
 The 2024 Technology Trends Report UPSTACK Page 14 Page 16