
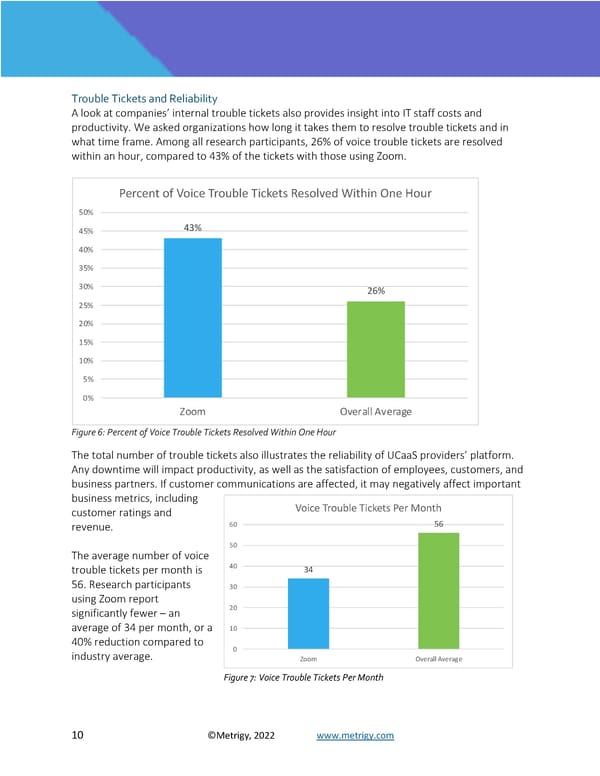
Trouble Tickets and Reliability A look at companies’ internal trouble tickets also provides insight into IT staff costs and productivity. We asked organizations how long it takes them to resolve trouble tickets and in what time frame. Among all research participants, 26% of voice trouble tickets are resolved within an hour, compared to 43% of the tickets with those using Zoom. Percent of Voice Trouble Tickets Resolved Within One Hour 50% 45% 43% 40% 35% 30% 26% 25% 20% 15% 10% 5% 0% Zoom Overall Average Figure 6: Percent of Voice Trouble Tickets Resolved Within One Hour The total number of trouble tickets also illustrates the reliability of UCaaS providers’ platform. Any downtime will impact productivity, as well as the satisfaction of employees, customers, and business partners. If customer communications are affected, it may negatively affect important business metrics, including Voice Trouble Tickets Per Month customer ratings and revenue. 60 56 50 The average number of voice trouble tickets per month is 40 34 56. Research participants 30 using Zoom report significantly fewer – an 20 average of 34 per month, or a 10 40% reduction compared to 0 industry average. Zoom Overall Average Figure SEQ Figure \* ARABIC 7: Voice Trouble Tickets Per Month Figure 7: Voice Trouble Tickets Per Month 10 ©Metrigy, 2022 www.metrigy.com
 Zoom UCaaS Cost Assessment Page 9 Page 11