
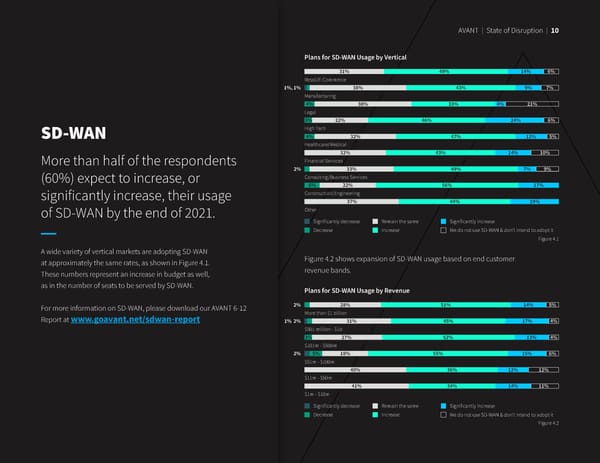
AVANT | State of Disruption | 10 Plans for SD-WAN Usage by Vertical 31% 49% 14% 6% Retail/E-Commerce 1%, 1% 38% 43% 9% 7% Manufacturing 4% 38% 33% 4% 21% Legal 3% 22% 46% 24% 6% High Tech SD-WAN 4% 32% 47% 12% 5% Healthcare/Medical 32% 43% 14% 10% More than half of the respondents Financial Services 2% 33% 49% 7% 9% (60%) expect to increase, or Consulting/Business Services 6% 22% 56% 17% significantly increase, their usage Construction/Engineering 37% 44% 19% of SD-WAN by the end of 2021. Other Significantly decrease Remain the same Significantly increase Decrease Increase We do not use SD-WAN & don’t intend to adopt it Figure 4.1 A wide variety of vertical markets are adopting SD-WAN at approximately the same rates, as shown in Figure 4.1. Figure 4.2 shows expansion of SD-WAN usage based on end customer These numbers represent an increase in budget as well, revenue bands. as in the number of seats to be served by SD-WAN. Plans for SD-WAN Usage by Revenue For more information on SD-WAN, please download our AVANT 6-12 2% 28% 51% 14% 5% Report at www.goavant.net/sdwan-report More than $1 billion 1% 2% 31% 45% 17% 4% $501 million - $1b 3% 27% 52% 13% 4% $101m - $500m 15% 2% 5% 18% 55% 15% 6% $51m - $100m 40% 36% 12% 12% $11m - $50m 41% 34% 14% 11% $1m - $10m Significantly decrease Remain the same Significantly increase Decrease Increase We do not use SD-WAN & don’t intend to adopt it Figure 4.2
 State of Disruption 2021 Page 11 Page 13