
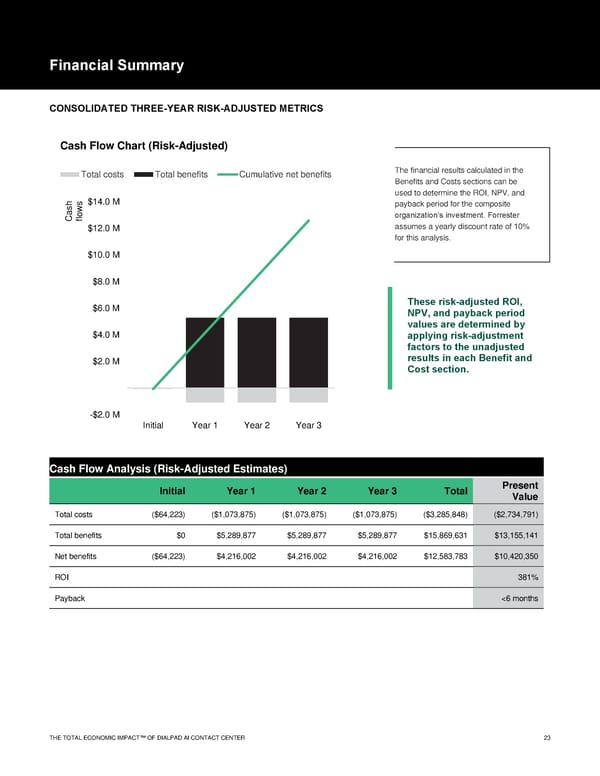
Financial Summary CONSOLIDATED THREE-YEAR RISK-ADJUSTED METRICS Cash Flow Chart (Risk-Adjusted) Total costs Total benefits Cumulative net benefits The financial results calculated in the Benefits and Costs sections can be used to determine the ROI, NPV, and h s$14.0 M payback period for the composite ow Casfl organization’s investment. Forrester $12.0 M assumes a yearly discount rate of 10% for this analysis. $10.0 M $8.0 M $6.0 M These risk-adjusted ROI, NPV, and payback period values are determined by $4.0 M applying risk-adjustment factors to the unadjusted $2.0 M results in each Benefit and Cost section. -$2.0 M Initial Year 1 Year 2 Year 3 Cash Flow Analysis (Risk-Adjusted Estimates) Initial Year 1 Year 2 Year 3 Total Present Value Total costs ($64,223) ($1,073,875) ($1,073,875) ($1,073,875) ($3,285,848) ($2,734,791) Total benefits $0 $5,289,877 $5,289,877 $5,289,877 $15,869,631 $13,155,141 Net benefits ($64,223) $4,216,002 $4,216,002 $4,216,002 $12,583,783 $10,420,350 ROI 381% Payback
 The Economic Impact of Contact Center AI Page 24 Page 26